
Heart Rate, Reimagined: From Averages to Intentional Control
Heart rate has always been central to endurance training—but most tools still reduce it to a single average. The problem is that averages hide behavior. They flatten spikes, smooth over drift, and often miss the moments that matter most.
In this release, we rebuilt heart rate analysis across MyRuns to answer more meaningful questions:
- Did you run steadily?
- Did your effort stay under control?
- Did your training align with what you intended to do?
Let’s walk through what’s new—and how to use it.
Single Runs: Seeing the True Shape of Effort
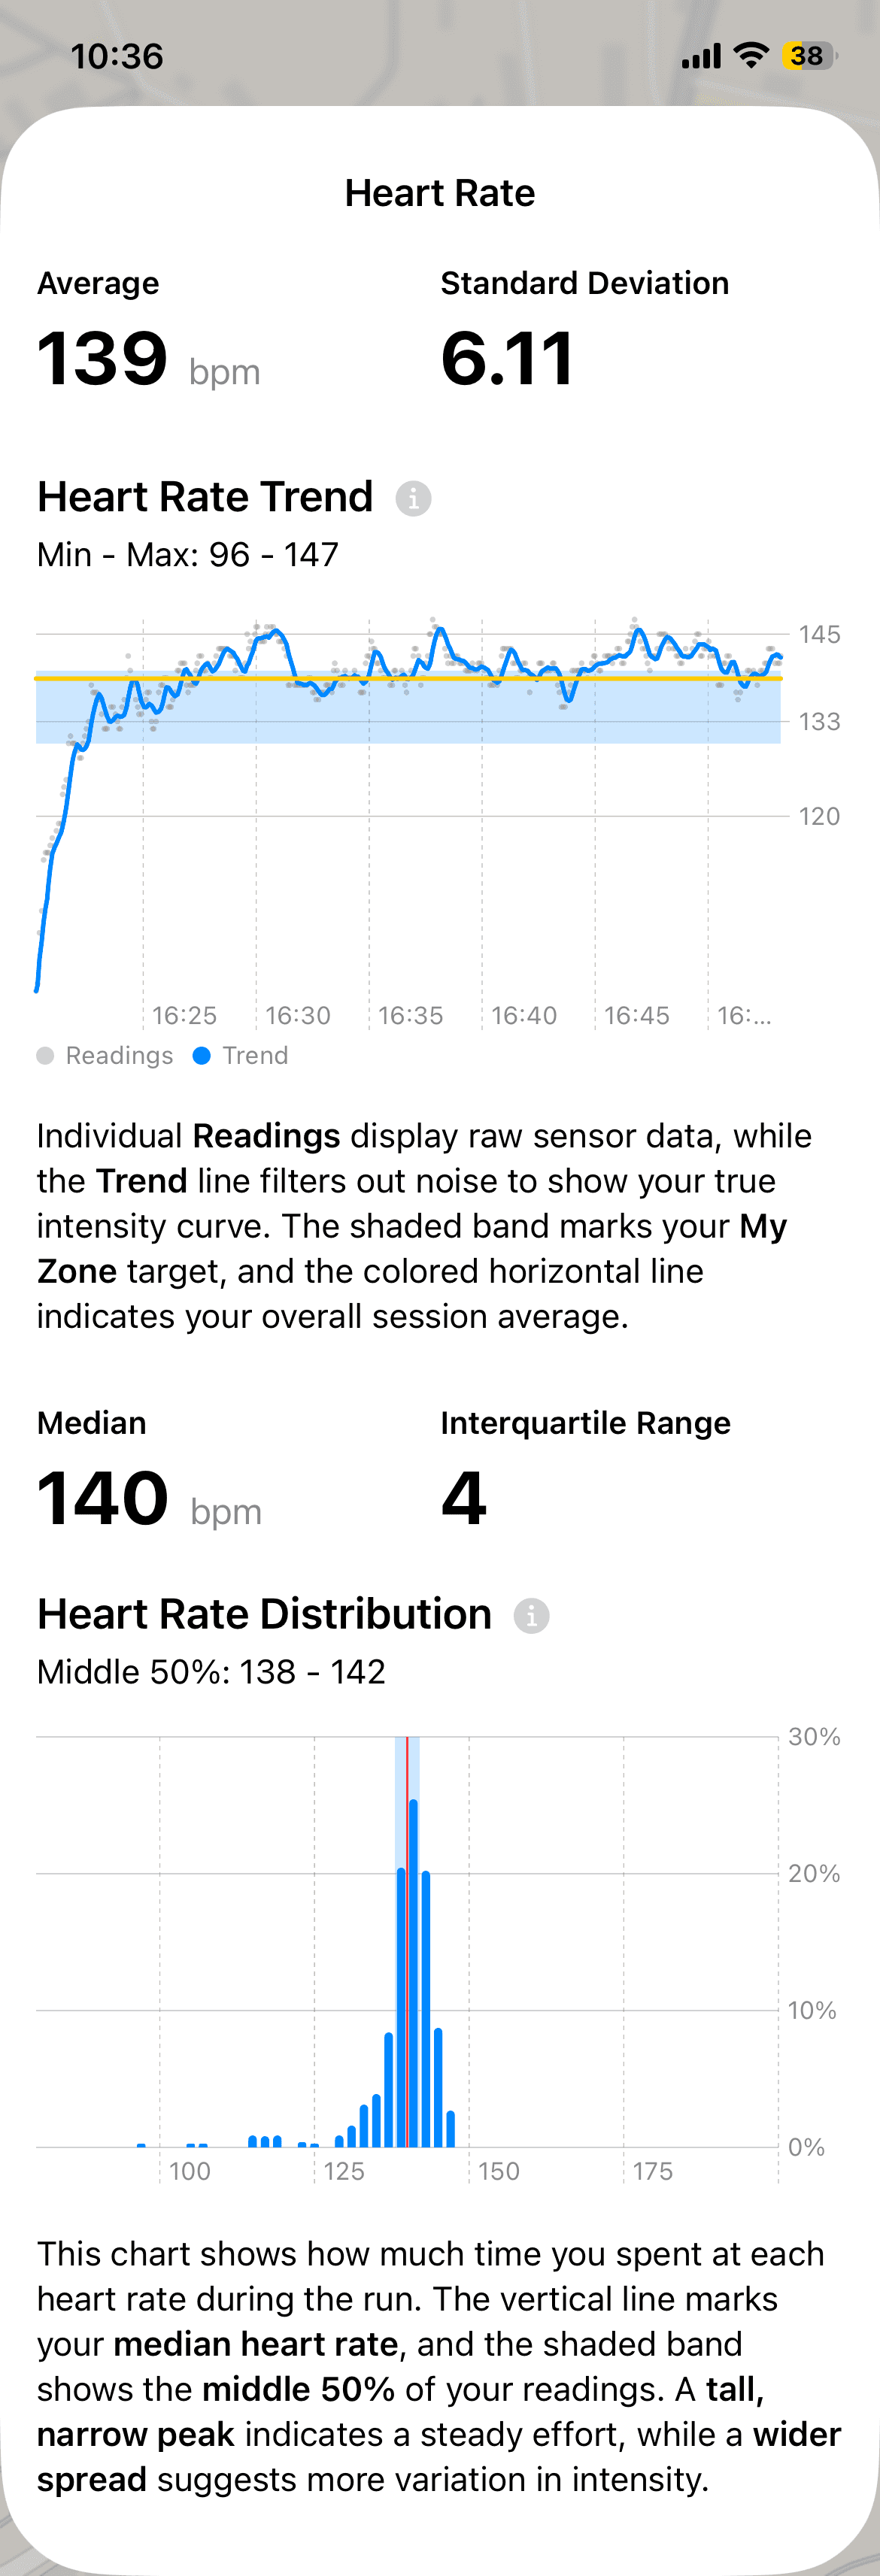
Heart Rate Trend: Readings vs. Reality
The Heart Rate Trend chart now separates raw sensor readings from a time-weighted trend line.
- Individual readings show what the sensor captured moment by moment.
- The trend line filters noise to reveal your underlying intensity curve.
- The shaded band represents your My Zone, and the horizontal line marks your overall session average.
This makes it easier to see whether your heart rate settled in, drifted upward, or stayed locked to your effort.
Heart Rate Distribution: Where Did the Run Actually Happen?
The Distribution chart shows how much time you spent at each heart rate during the run.
- The vertical line marks your median heart rate.
- The shaded band shows the middle 50% of your readings.
- A tall, narrow peak suggests a steady effort.
- A wider spread indicates more variation in intensity.
Rather than asking “What was my average?”, this chart answers: Where did I actually spend most of this run?
Weekly Progress: Did You Run as Intended?
A single run can be misleading. A week reveals patterns.
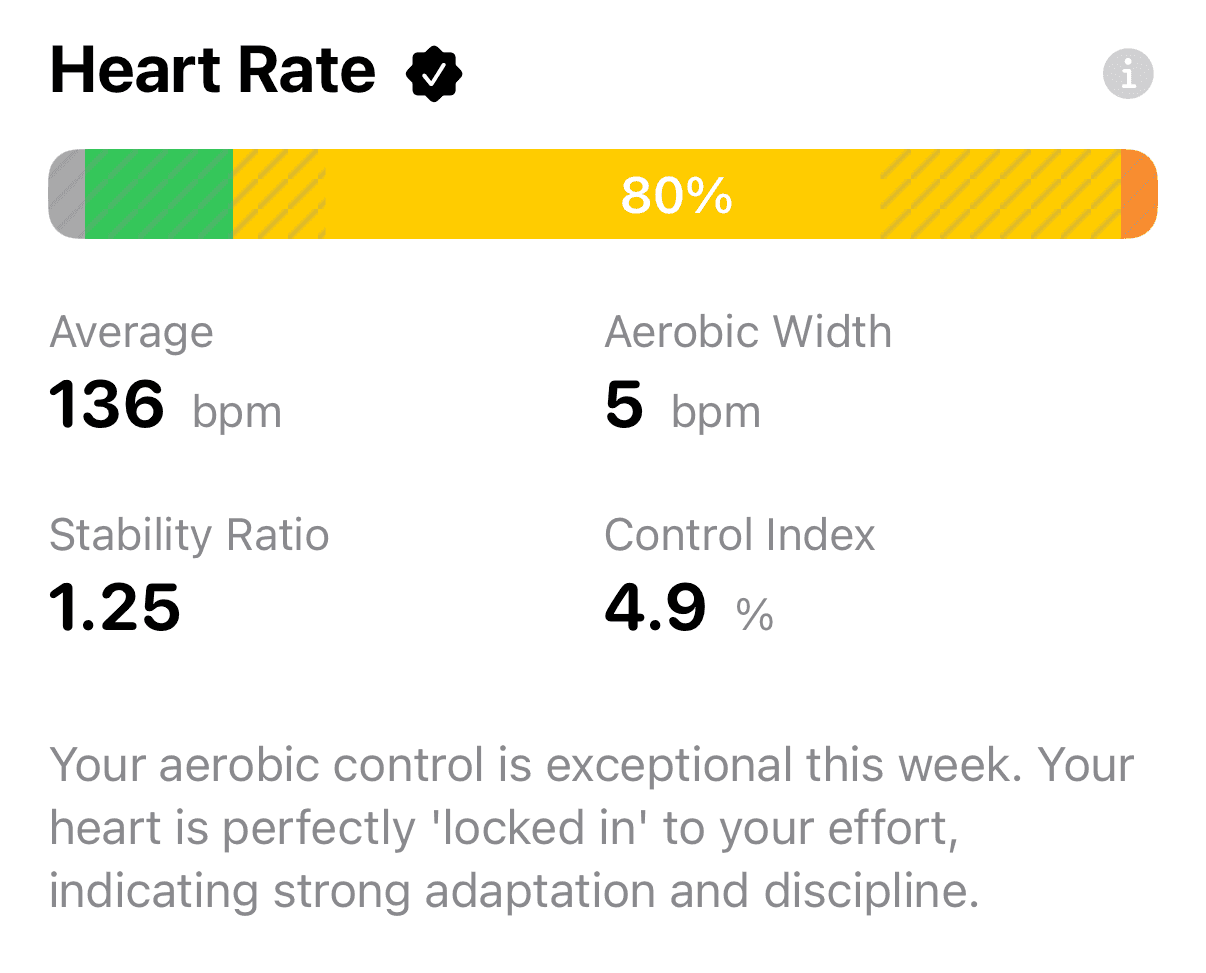
The redesigned Heart Rate section in the Progress tab introduces three new metrics that quantify discipline and control across your week:
- Control Index: Did your heart rate stay economical—or did intensity creep up and tax your system?
- Stability Ratio: How smooth were your runs? Higher values mean fewer spikes and less volatility.
- Aerobic Width: Did you maintain a tight, consistent effort—or drift across a wider range of intensities?
These metrics work together. When they are stable—and when your average heart rate stays within your personal My Zone—the app displays a ✓ checkmark. That mark means your training was both well executed and on purpose.
30 Days: Consistency You Can See
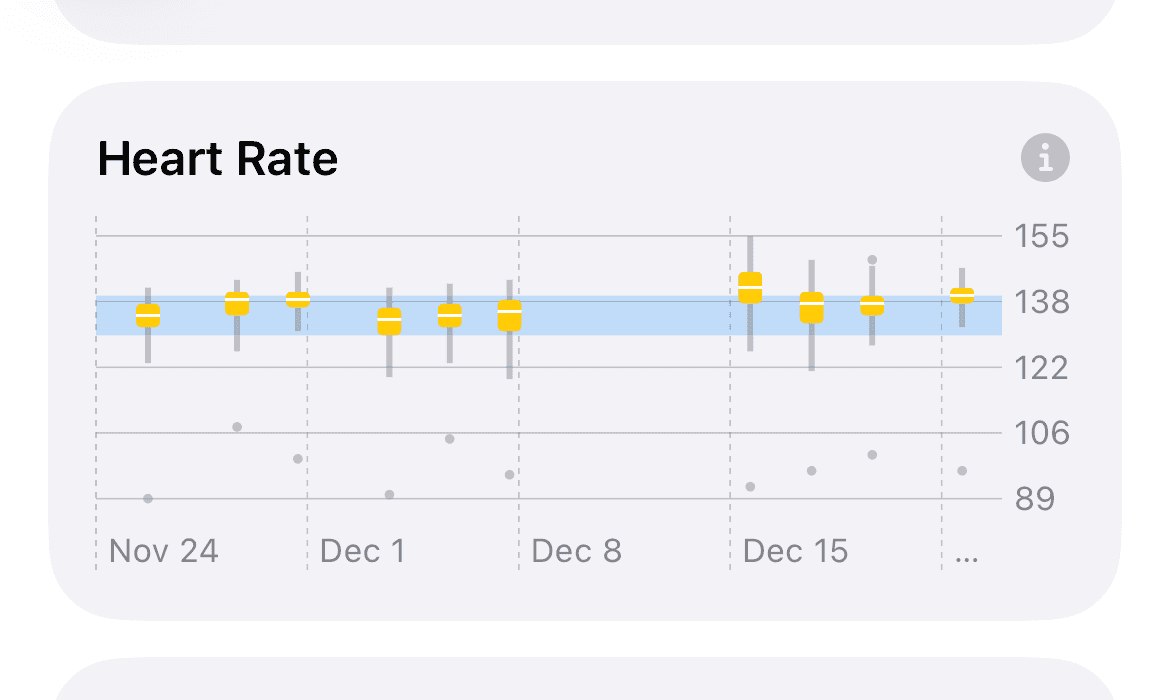
In the Insights tab, Heart Rate is now visualized using box plots for each run over the past 30 days.
- The box shows where the bulk of the run occurred.
- The whiskers show how high or low your heart rate extended.
- The shaded band represents your My Zone.
As you scan across runs, patterns emerge:
- Boxes creeping upward suggest accumulating fatigue at the same pace.
- Narrowing boxes reflect improving aerobic control.
- Alignment with My Zone shows consistency with intent.
This view helps you spot trends that averages simply can’t reveal.
Why Time-Weighted Analysis Matters
Heart rate sensors don’t sample evenly. Data points can cluster during surges, drop out briefly, or vary in frequency.
A standard average treats every reading equally. Time-weighted analysis asks a better question:
“How long were you actually at 150 bpm?”
By weighting heart rate by time, the metrics align with your real physiological experience—not just the quirks of sensor sampling. This is why the new charts and metrics feel more grounded, more stable, and more trustworthy.
The Takeaway
Heart rate isn’t just about intensity. It’s about control, consistency, and intent.
This update gives you the tools to see all three—clearly, honestly, and without guesswork.
Train steady. Train on purpose.
Last updated: December 23, 2025