
Redesign heart rate insight card
As we run, we collect heart rate samples with the help of wearables. We want these samples to tell a story and help us run better.
Previously I created the heart rate insight card. It has a line connecting the points representing the average heart rate of each run and an area representing the heart rate range of each run in the past 30 days. Generally I have one run in a day and run three days in a week. The card basically meets my needs. But sometimes I would have multiple runs in a day one of which would be a speed run, an interval run, or a fartlek run. In this case, the line and the area would feel jumpy because multiple points would be positioned vertically which made me hard to see the trend clearly.
So I decided to redesign the chart as below.
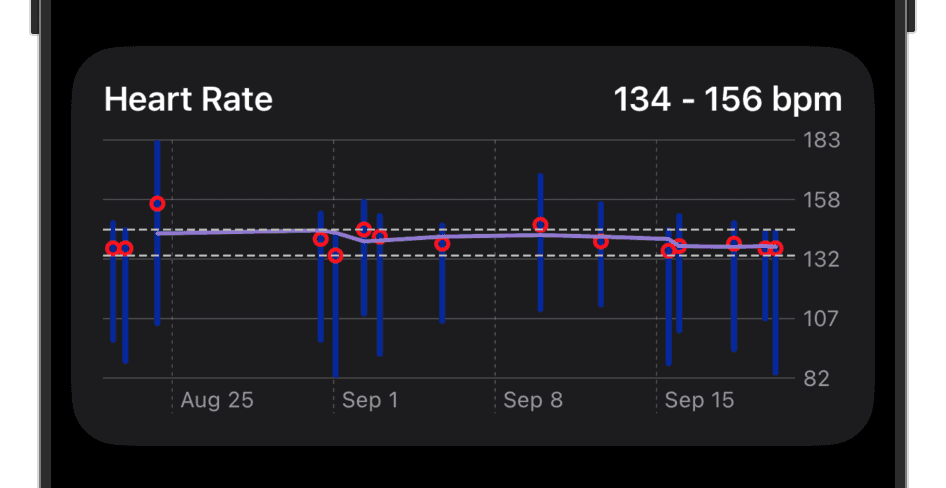
The points are placed at the exact date and time they occured just like before which naturally visualizes the time gap. The original line was too sensitive to day-to-day fluctuations, so I replaced it with a moving average line that's designed to smooth out those short-term changes and reveal the true, long-term trend. I also replaced the original area with vertical bars. This makes it clear to see the heart rate distribution of each run as well as the trend of heart rate range over time. Of course, the two dash lines are still there to help me determine where "My Zone" locates.
Now that you know what each element on the chart represents, let's talk about how to read your progress and understand what your body is telling you. When you look at your chart, you're not just seeing numbers—you're seeing a story about your training. The key is to look at the moving average line and the vertical bars together.
- Endurance and Efficiency
If you're training for a race or focusing on building your aerobic base, you want your body to become more efficient at a specific effort level. In this case, you're looking for signs of Stable Improvement.
- What to look for: The moving average line shows a consistent downward trend over time. Your vertical bars may also get slightly shorter, indicating that your heart rate is remaining more consistent and stable throughout each run.
- High-Intensity Performance
If your training plan includes intervals, sprints, or fartlek runs, you're intentionally pushing your body. Here, the "ideal" chart looks a little different.
- What to look for: Your moving average line should show a gradual upward trend during these intense training blocks. This indicates that your overall effort level is increasing, which is exactly what you want. Your vertical bars will be wider and more varied. This is a good sign—it means you are successfully pushing your heart rate high and recovering, which is the whole point of interval training.
The beauty of the moving average is that it will smooth out these individual spikes. It won't jump wildly; instead, it will show a more gradual, subtle rise and fall that reflects your training strategy. By thinking about your chart in terms of your training goals, you can get a much clearer picture of your progress.
Last updated: October 20, 2025