How do I use the app?
Last updated: July 4, 2024
How do I check my progress?
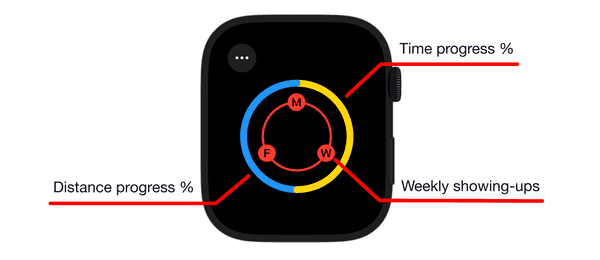
You can monitor your progress towards all your goals via the Run Ring, depicted in Figure 1.
The outer ring is bifurcated into two semi-circles. The yellow semi-circle signifies your progress in terms of time, calculated as the ratio of total time to the time goal. Conversely, the blue semi-circle represents your progress in terms of distance, calculated as the ratio of total distance to the distance goal.
The inner ring contains several circles, each symbolizing a day of the current week. A maximum of 7 circles, evenly distributed, can be present on the inner ring, corresponding to the day goal. Initially, these circles are hollow. However, once a run is completed on a particular day, the corresponding circle is filled in red and marked with the weekday symbol.
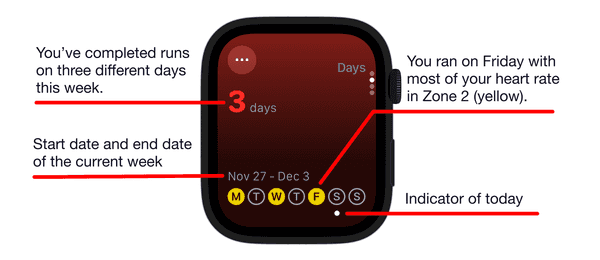
Could you explain the weekly status section in the Days tab?
It displays seven circles representing the days of the week, depicted in Figure 2. Circles corresponding to days with runs are filled. The color of a filled circle matches the color of the heart rate zone where the maximum percentage of your running heart rate was recorded. The color scheme for the heart rate zones can be located on the Settings page. A dot indicator is placed under the circle representing today.
This feature allows you to effortlessly plan your upcoming run, keeping a balanced approach to workout and recovery in mind.
Could you explain the intensity section in the Time tab?
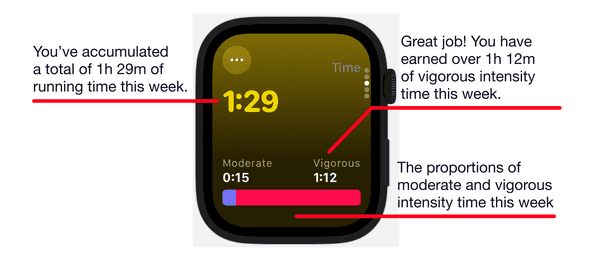
It displays the time you ran at different intensities and visualizes the proportions of your moderate and vigorous intensity time this week, as illustrated in Figure 3. You can find the heart rate range, as well as the color scheme for each exercise intensity, in the Settings view.
Could you explain the heart rate section in the Distance tab?
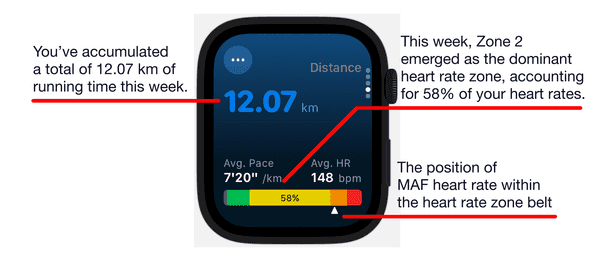
It visualizes the distribution of your weekly running heart rates across each heart rate zone, as depicted in Figure 4. It enables you to easily understand the proportion of each heart rate zone and the percentage of the dominant heart rate zone. The color scheme corresponding to the heart rate zones can be found on the Settings page. An upward arrow indicator, positioned under the heart rate zone belt, marks the location of the Maximum Aerobic Function (MAF) heart rate.
This feature proves particularly beneficial if you’re tailoring your runs to target a specific heart rate zone.
Can you explain the run list?
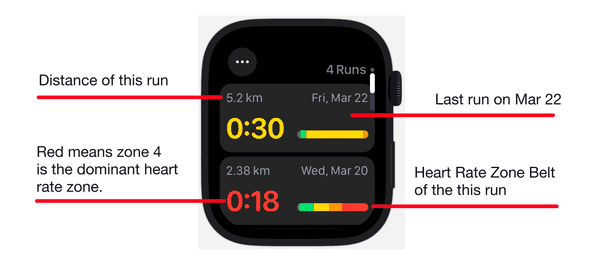
The run list displays the runs for the current week, with the most recent run at the top of the list, depicted in Figure 5. It provides information on the time and distance of each run, as well as the heart rate distribution and the dominant heart rate zone.
What complications are supported?
My Runs provides a diverse range of complications, each tailored to different sizes and scenarios. The Day Progress, Time Progress, and Distance Progress support both circular and corner complications. The FITT is compatible with rectangular and inline complications, while the Run Ring supports both rectangular and circular complications.
Where is my data stored?
All your run data, along with other health data recorded by your Apple Watch, is stored in your Health store. Currently, My Runs does not write to your Health store. It only reads the necessary data from your Health store for calculations and does not transmit your data outside of your device without your consent. In fact, My Runs operates without the need for a backend server. Rest assured, your data remains under your control.
Looking for the User Guide for the iPhone app? It's here.
