How do I use the app?
Last updated: August 16, 2024
How do I set my goals and track my progress?
To set your goals and track your progress in the iPhone app, you can follow these steps:
- Open the Settings page by tapping the settings button at the top left corner of the progress page.
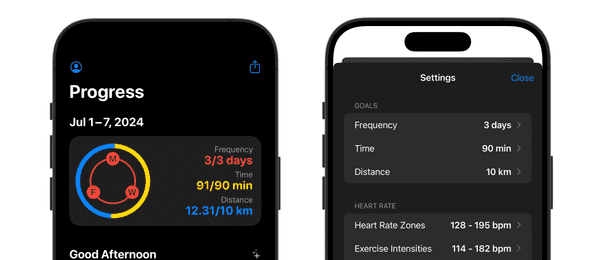
- In the Settings page, you can set your goals as illustrated in Figure 1.
- To track your progress, you can use the Run Ring in the progress page, which is similar to what you do in the Apple Watch app.
What is the Time section?
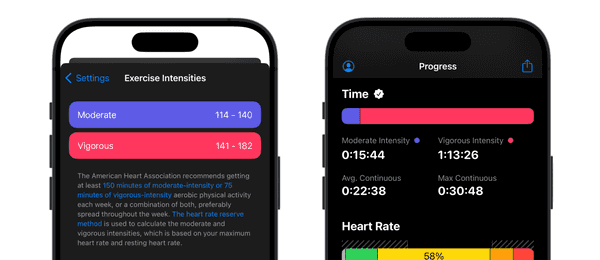
The Time section shows you how much time you spent running at different intensity levels. It also compares your running time with the goal recommended by the American Heart Association (AHA). If you meet or exceed the AHA goal, you will see a check mark next to the Time section title, as shown in Figure 2.
You can also view the intensity ranges as well as how they are defined and calculated in the Exercise Intensities settings view.
How do I delve into the time details of a run?
When viewing a run, follow these steps to explore the time details:
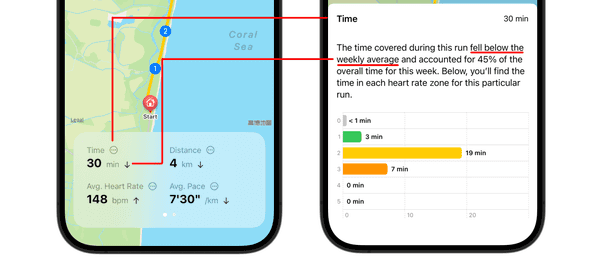
- Look for the ellipsis button next to the Time title (as shown in Figure 3).
- Tap the ellipsis button to open the Time sheet.
- Inside the sheet, you’ll find a breakdown of time spent in each heart rate zone.
If you notice an up-arrow next to your run’s time value, it indicates that this run’s time exceeded the weekly average, just as what the description says in the time sheet. Conversely, if you see an down-arrow, it indicates that the run's time was lower than the weekly average. No arrow means that the run's time aligned with the weekly average.
Additionally, you can also access similar sheets for the average heart rate, distance and pace of this run.
How are my heart rate zones calculated?
Your heart rate zones are determined using the heart rate reserve method, which takes into account your maximum heart rate and resting heart rate. The maximum heart rate is computed using the formula (220 - your age). Your resting heart rate is recorded by your Apple Watch. This method is also employed by the built-in Workout app to calculate your heart rate zones. However, while the Workout app syncs your resting heart rate on the first day of each month, My Runs uses the average resting heart rate from the past week by default. Additionally, you have the option to manually input your resting heart rate.
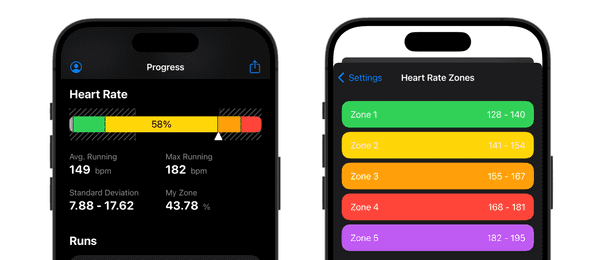
You can view the range and color associated with each heart rate zone on the Settings page, as depicted in Figure 4.
How do I set My Zone?
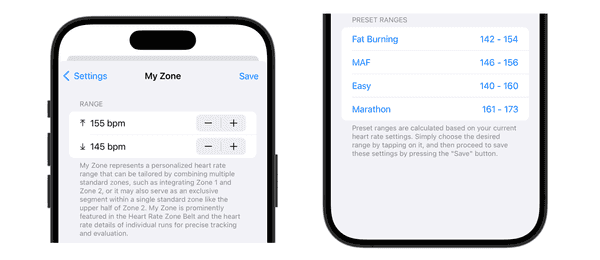
Setting up My Zone can be easily done through your iPhone app's Settings, as illustrated in Figure 5. You have the flexibility to manually input lower and upper bounds or opt for one of the preset ranges: Fat Burning, MAF (Maximum Aerobic Function), Easy, and Marathon. These presets are calculated based on your current heart rate settings. Once that's done, you'll be able to view it in the Heart Rate Zone Belt as illustrated in Figure 9.
What is MAF heart rate and how is it calculated?
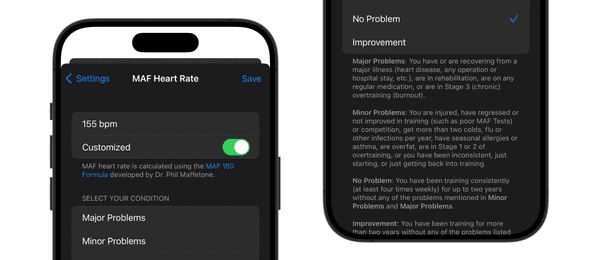
The MAF (Maximum Aerobic Function) heart rate is a training level defined by the Maffetone Method that aims to ensure you’re exercising in a way that improves your aerobic system. It’s calculated using the formula: 180 - your age. This method encourages training at or below this heart rate level to enhance aerobic fitness and endurance without over-stressing the body. Please note that this is a general guideline and individual MAF heart rate may vary. For more details, you can refer to the official pages.
You can view and customize your MAF heart rate on the Settings page, as depicted in Figure 6.
How do I use the Last Run widget?
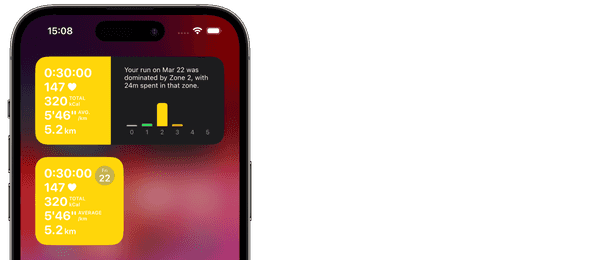
You can add this widget to your iPhone's Home Screen or Today View. It supports both small and medium sizes as demonstrated in Figure 7.
Within this widget, you’ll find a comprehensive summary of your most recent run. Here’s what it displays:
- Date of the Run: When you completed your last run.
- Total Time: The duration of the run.
- Average Heart Rate: Your average heart rate during the run.
- Total Energy: The total energy burned during your workout.
- Average Pace: Your average pace during the run.
- Total Distance: The distance covered.
Additionally, in the medium-sized widget, you’ll see a visual breakdown of the time spent in each heart rate zone, along with the dominant heart rate zone. The background color of the small-size widget and the left part of the medium-size widget will change based on the dominant heart rate zone. In Figure 7, yellow indicates that the dominant heart rate zone is Zone 2.
How do I use the FITT widget?
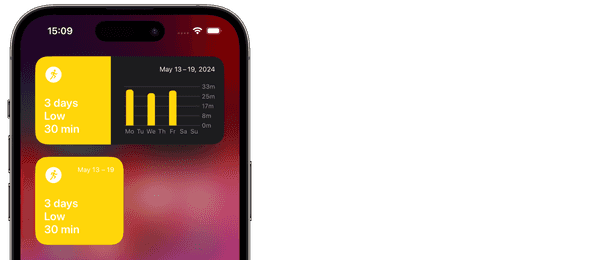
You can add this widget to your iPhone's Home Screen or Today View. It supports both small and medium sizes as demonstrated in Figure 8.
Within this widget, you’ll find the summary of your weekly FITT status. Here’s what it displays:
- Frequency: the days you have run this week.
- Intensity: the dominant intensity of this week. There're 5 level of intensity: Very Low, Low, Medium, High and Very High.
- Time: the average time you spent on each day.
- Type: running as indicated by the image at the top left corner of this widget.
Additionally, in the medium-size widget, you'll see a visual breakdown of the time spent in each day of the current week. Each bar in the chart is color-coded based on the dominant intensity of that day. The background color of the small-size widget and the left part of the medium-size widget will change to reflect the dominant intensity of this week. In Figure 8, yellow indicates that the dominant intensity of this week is Low.
How do I use the Heart Rate Zone Belt widget?
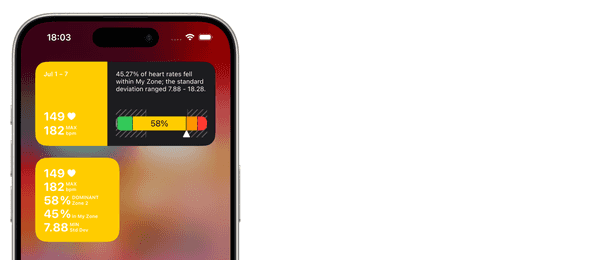
You can add this widget to your iPhone's Home Screen or Today View. It supports both small and medium sizes as demonstrated in Figure 9.
Within this widget, you’ll find the summary of your weekly running heart rates. Here’s what it displays:
- Average Heart Rate: Your average heart rate for the current week.
- Heart Rate Range: Your minimum and maximum heart rates for the current week.
- My Zone Percentage: The percentage of heart rates that fell within My Zone for the current week.
- Standard Deviation Range: Your minimum and maximum heart rate standard deivations for the current week. One run has one heart rate standard deviation value.
- Heart Rate Zone Belt: Your heart rate distribution in each heart rate zones for the current week with a MAF heart rate indicator at the botton. The space between the left and right mask in the background represents My Zone.
How do I set up Gemini for AI Coaching?
To set up Gemini for AI Coaching in the iPhone app, you can follow these steps:
- Register and get an API key in Google AI Studio.
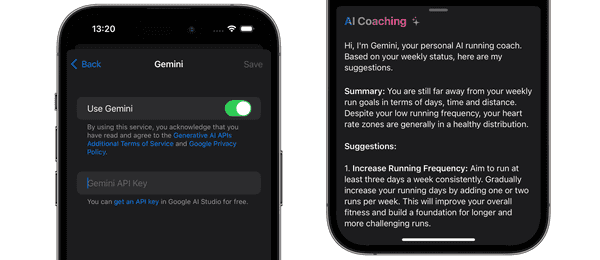
- In Gemini setting page, enable Gemini, type in your Gemini API key, and tap the Save button.
- When you’re done, you’ll see a sparkles button in the Today’s Suggestion section title. Tap it and you’ll see the AI Coaching sheet as illustrated in Figure 10.
By using Gemini, you acknowledge that you have read and agree to the Generative AI APIs Additional Terms of Service and Google Privacy Policy.
How do I set up OpenWeather for weather forecasts?
To set up OpenWeather for weather forecasts in the iPhone app, you can follow these steps:
- Sign up and get an API key on your account page.
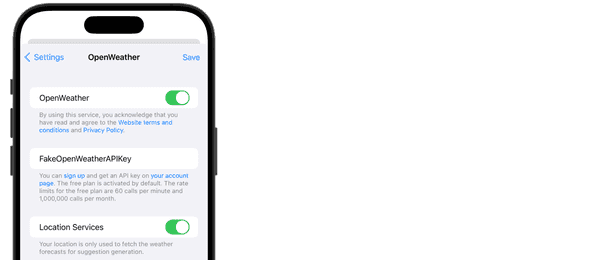
- In OpenWeather setting page, enable OpenWeather, type in your OpenWeather API key, as illustrated in Figure 11.
- Enable Location Services, and choose Allow When Using App when prompted.
- When you’re done, tap the Save button. You'll be able to see a summary like this every time you open the app.
Today will have rain in the evening with feels-like temps in 28-31°C. Over the next 4 days, Fri will feel like the hottest with feels-like temps around 38°C, while Sat, Sun have chances of thunderstorms with cooler feels-like temps in 31-35°C.
Note that this is not a weather app. The weather forecasts here are for your convenience to help you plan your next run. If you've already run today, you won't see today's forecast. Once your weekly goals are met, you'll no longer see the weather forecasts.
How do I sync my run data from Apple Health?
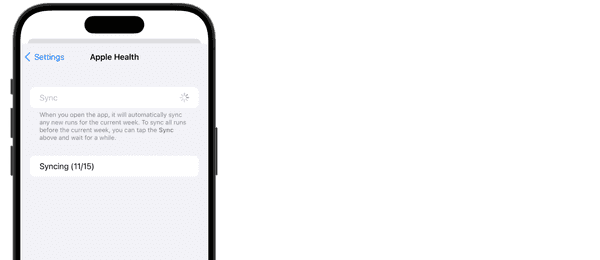
You can do this by tapping the Sync button in the Apple Health settings page. It will check and sync any run data that is in Apple Health but not in the app. You can also see the sync progress, as well as how many runs to sync in total, as illustrated in Figure 12. Sit back and relax until the sync completes.
Whenever you open the app, it will automatically sync your run data for the current week from Apple Health. The best way to keep your run data in sync is to start the manual sync at least once, and then open the app every week when you finish new runs. However, if you forget to open the app for a past week, don't worry – you can start the manual sync again to sync the missing runs.
Why do the charts in the Insights tab show less data than what I have in the Apple Health?
If you have run data in the Apple Health before August 16, 2024 (the Insights tab release date), you'll need to manually sync that data before using it in the Insights tab. Refer to the answer to the previous question for how to start the manual sync.
Looking for the User Guide for the Apple Watch app? It's here.
